Relative Strength Indicator (RSI) in Trading- Complete Analysis
Lets Understanding the Relative Strength Index (#RSI) in Trading
The Relative Strength Index (RSI) is a widely used momentum oscillator in technical analysis that helps traders evaluate the strength of a stock or asset’s price movement. Developed by J. Welles Wilder in 1978, RSI measures the magnitude of recent price changes to determine overbought or oversold conditions.

How RSI Works
RSI is calculated using the following formula:
Where:
- RS (Relative Strength) = Average Gain / Average Loss over a specified period (typically 14 days).
RSI values range from 0 to 100. Generally, an RSI above 70 indicates that an asset may be #overbought and due for a #correction, while an RSI below 30 suggests it may be #oversold and poised for a rebound.
Interpretation of RSI
-
Overbought and Oversold Levels
- RSI > 70: The asset is considered overbought, meaning the price may experience a reversal or pullback.

- RSI < 30: The asset is considered oversold, signaling a potential buying opportunity.
-
Divergences
- Bullish Divergence: RSI forms higher lows while the price forms lower lows, indicating a potential upward reversal.

- Bearish Divergence: RSI forms lower highs while the price forms higher highs, signaling a potential downtrend
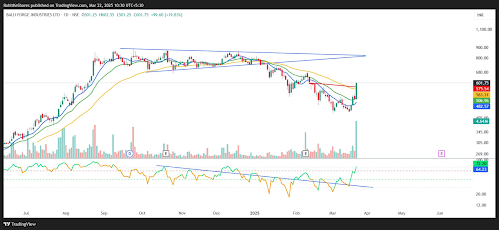
- Here in the #Nifty chart, we can see, the price forming Higher high.. while the RSI forming a downtrend, indicating a probable, price downtrend.

-
RSI Trendlines & Patterns RSI often follows trends similar to price movements. Breakouts in RSI trendlines can signal upcoming price movements.
-
RSI Swing Rejections
- A bullish #swing rejection occurs when RSI enters the oversold zone, moves above 30, drops slightly, and then surges again.

- A bearish swing rejection occurs when RSI enters the overbought zone, moves below 70, rises slightly, and then declines further.

RSI Trading Strategies
1. RSI Overbought/Oversold Strategy
- Buy when RSI is below 30 and starts moving upward.
- But this is not always fruitful in short term trading. In long term this can be realized... as price and RSI can remain below 30 for a longer period of time.

- Sell when RSI is above 70 and starts declining.
2. RSI Divergence Strategy
- Look for bullish or bearish #divergences to anticipate trend reversals.
3. RSI Trend Confirmation
- Combine RSI with moving averages or trendlines to confirm trade signals.

4. RSI and Moving Average Convergence Divergence (MACD)
- Using RSI with #MACD can strengthen trading signals by confirming momentum shifts.
Limitations of RSI
- RSI can remain in overbought or oversold conditions for extended periods during strong trends, leading to false signals.
- It should be used in conjunction with other indicators, such as volume, support and resistance levels, or candlestick patterns.
Conclusion
The RSI is a powerful technical analysis tool that helps traders gauge momentum and identify potential reversals. By understanding its signals and combining it with other indicators, traders can improve their decision-making process and enhance their trading strategies. However, no indicator is foolproof, so risk management and a well-rounded approach to analysis are crucial for success in trading.
Comments
Post a Comment